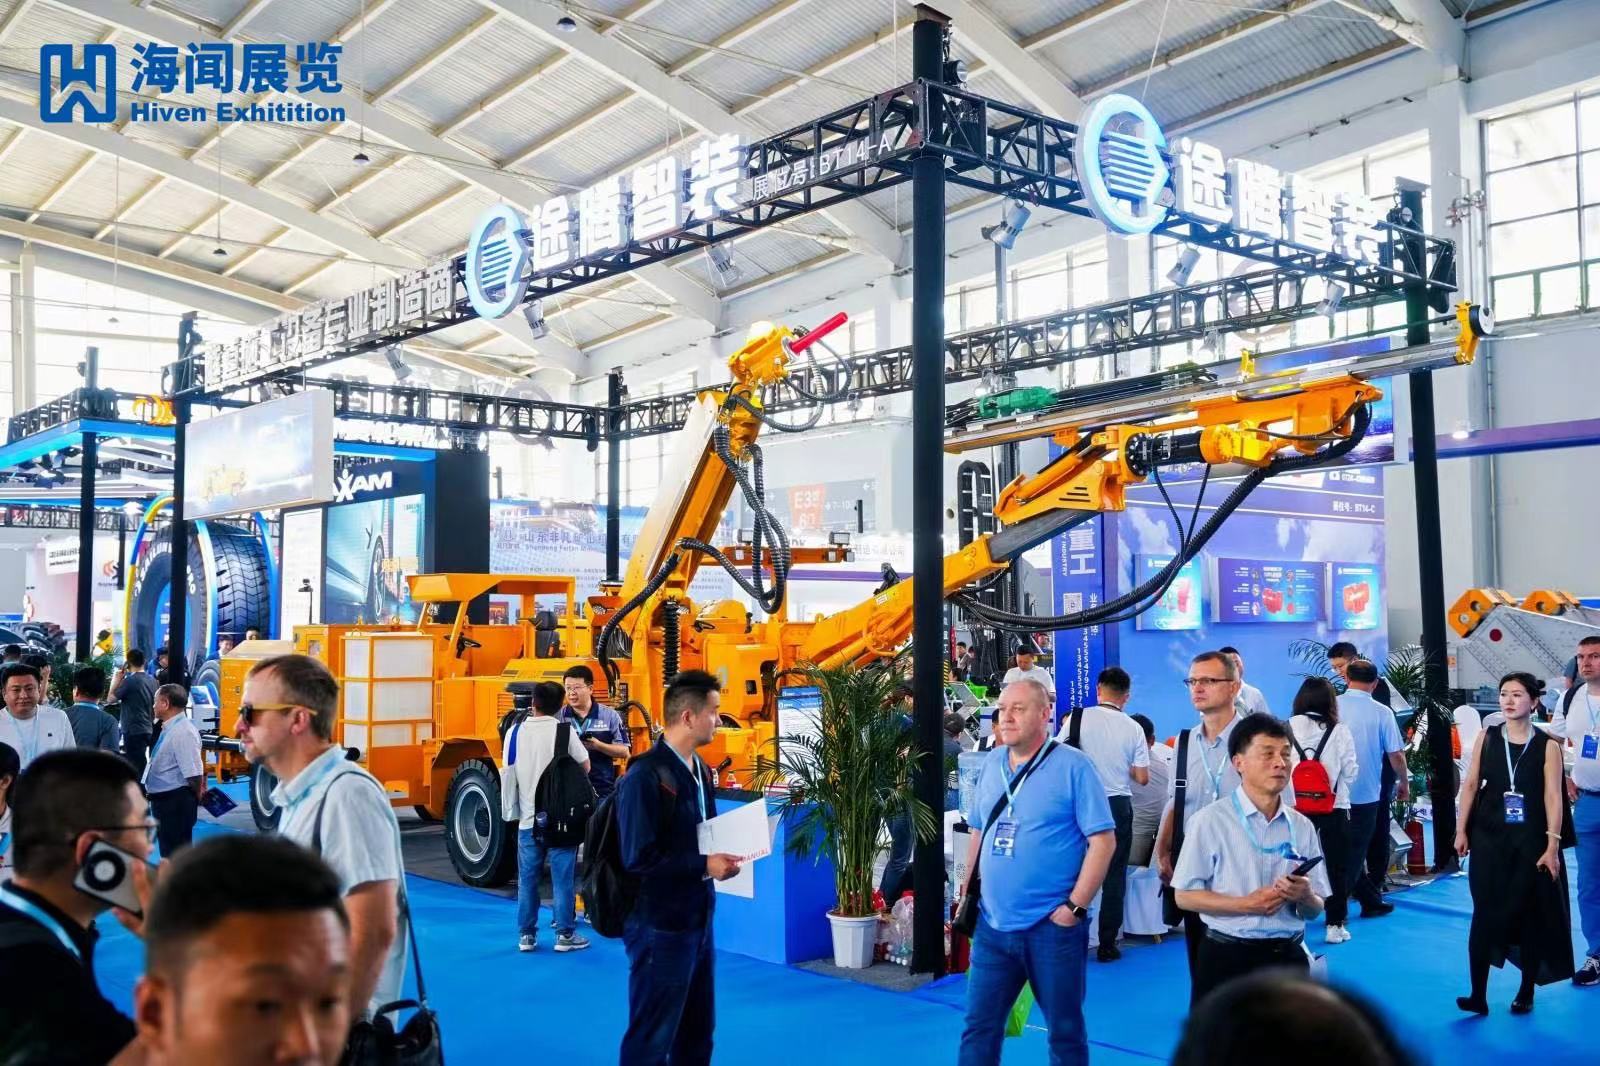
News

Position:Home > MEDIA > News


A Comparative Analysis of Steel Companies’Leverage

A Comparative Analysis of Steel Companies’ Leverage
 
By Mark O'Hara  | Aug 22, 2017 9:27 am EDT
 
PART 1
Steel companies’ leverage
The metals and mining sector is capital intensive. Companies have to invest considerably to upgrade their facilities and invest in new projects. As a result, metals and mining companies (XME) have to borrow money to meet their capital requirements. However, leverage is a double-edged sword. Companies with higher financial leverage usually outperform their peers in an up cycle. However, during market downturns, which are more of a norm rather than an exception in the cyclical steel industry (MT), companies with a high level of financial leverage come under selling pressure.
 
Operating leverage
Notably, along with higher financial leverage, some steel stocks like U.S. Steel (X) and AK Steel (AKS) also have a high level of operating leverage due to their high fixed cost structure. However, Nucor (NUE) and Steel Dynamics have relatively lower operating leverage due to their low fixed cost structure.
Steel companies have high sensitivity to steel prices and their earnings tend to be volatile. Spot steel prices have been volatile in the last few years, which led to huge swings in some companies’ profits—especially U.S. Steel.
 
Series overview
Having comfortable leverage ratios allows a company to pursue inorganic and organic growth without worrying much about the funding dynamics. Also, companies with lower leverage ratios have better credit ratings, which has a positive impact on their financing costs. In this series, we’ll compare steel companies’ leverage ratios. We’ll also compare steel companies’ financial leverage based on different financial metrics.
 
PART 2
Comparing Nucor and Steel Dynamics’ Interest Coverage Ratio
Interest coverage ratio
In this part, we’ll look at different steel companies’ interest coverage ratios. An interest coverage ratio is a company’s EBITDA (earnings before interest, tax, depreciation, and amortization) divided by its interest expense. It measures a company’s ability to make interest payments. A higher ratio is associated with low financial leverage.
 
Comparative analysis
U.S. Steel (X) has an interest coverage ratio of 1.67x based on its 2016 EBITDA and 4.43x based on its 2017 consensus EBITDA. AK Steel’s (AKS) interest coverage ratio is 3.33x based on its fiscal 2017 EBITDA. ArcelorMittal (MT), the world’s biggest steelmaker, has an interest coverage ratio of 5.34x based on its fiscal 2016 EBITDA and 7.77x based on its fiscal 2017 consensus EBITDA.
 
Nucor and Steel Dynamics
Nucor (NUE) and Steel Dynamics (STLD) have high interest coverage ratios—compared to most of their peers. While Steel Dynamics has an interest coverage ratio of 7.92x based on its 2016 EBITDA, Nucor’s interest coverage ratio is 11.75x based on last year’s EBITDA. Notably, Nucor has the highest interest coverage ratio in our coverage of steel stocks. Nucor is the only North American steel company that carries an “investment grade” credit rating. Steel Dynamics and ArcelorMittal could also be strong candidates for a credit rating upgrade if steel market conditions continue to improve.
 
Along with the interest coverage ratio, we also need to look at some other ratios—for example, the DE (debt-to-equity) ratio. In the next part, we’ll provide a comparative analysis of steel companies’ DE equity ratios.
 
 
PART 3
ArcelorMittal’s Leverage Ratio versus Its Peers
 
In the previous part, we looked at steel companies’ interest coverage ratios. In this part of the series, we’ll look at their DE (debt-to-equity) ratios. We should remember that the DE ratio is a balance sheet metric that tells us about a company’s capital structure. The ratio tells us how much debt a company has on its balance sheet compared to shareholder equity.
 
U.S. Steel (X) has a DE ratio of 115% as of June 30, 2017. AK Steel (AKS) has a negative net worth due to accumulated losses. Among other steel companies (CLF), Nucor (NUE) has a debt-to-capital ratio of 52%, while Steel Dynamics’ DE ratio is 77%. ArcelorMittal (MT) has the lowest DE ratio of 42% in our coverage of steel stocks.
 
Understanding these numbers
A lower DE ratio means that the company is using less debt compared to equity. However, we should remember that it’s basically a balance sheet metric and not very useful in determining a company’s current financial position. For instance, AK Steel has negative shareholder equity due to legacy issues, while ArcelorMittal’s shareholder equity rose last year after its raised ~$3 billion through a rights issue. Other steel companies like U.S. Steel also raised cash by selling shares last year.
 
A better indicator to measure a company’s financial position is its net debt-to-market capitalization ratio. The ratio also takes into account the current market capitalization and could help us understand a company’s leverage position.
In the next part, we’ll discuss how different steel companies’ net debt looks compared to their market capitalizations.


PART 4
Why AK Steel Still Has a Balance Sheet Problem
 
Balance sheet
Steel stocks saw their leverage ratios get worse in 1Q16. However, we’ve come a long way since then. Not only have the earnings improved, some companies raised equity to strengthen their balance sheets. Having said that, some steel companies’ balance sheets still don’t look comfortable. In this part, we’ll look at the market capitalization-to-net debt ratio. The net debt is from the 2Q17 filings and the market capitalization is based on the closing prices on August 18.
 
Comparative analysis
Nucor (NUE) and Steel Dynamics have healthy market capitalization-to-net debt ratios, as you can see in the above chart. ArcelorMittal’s (MT) market capitalization is 2.2x its net debt, which looks somewhat on the higher side.
 
U.S. Steel’s (X) market capitalization is 3x its net debt, while AK Steel’s market capitalization is 1.1x its net debt. In the past, both of these companies faced a situation where their debt was much higher than their market capitalization. In 2015, AK Steel’s total outstanding debt was more than 6x its market capitalization.
 
AK Steel
AK Steel’s (AKS) current market capitalization-to-net debt ratio is the lowest in our coverage of steel stocks (CLF). We haven’t considered the underfunded pension and OPEB (other post-employment benefits) yet. As of December 31, 2016, AK Steel had an underfunded pension and OPEB liability of $1.1 billion, while U.S. Steel’s pension and OPEB plans were underfunded by $1.2 billion.
 
AK Steel’s financial position looks weak if we consider its debt and other liabilities—compared to its market capitalization. Although the company has taken some measures to address its leverage ratios, the balance sheet still can’t be called “healthy.”
 
In the next part, we’ll look at steel companies’ financial leverage.
 
PART 5
U.S. Steel or AK Steel: Which Has Higher Financial Leverage?
 
Previously in this series, we looked at several financial metrics like interest coverage and debt-to-equity ratios to analyze steel companies’ financial leverage ratios (HYG). Along with these ratios, investors and credit rating agencies also look at the net debt-to-EBITDA (earnings before interest, tax, depreciation, and amortization) ratio. The ratio helps us gauge a company’s debt levels compared to its earnings. In this part, we’ll look at steel companies’ net debt-to-EBITDA ratios based on their TTM (trailing 12-month) earnings.
 
Comparative analysis
Steel Dynamics has the lowest financial leverage in our coverage of steel stocks based on the net debt-to-TTM EBITDA. Nucor’s (NUE) financial leverage ratio is slightly higher compared to Steel Dynamics, as you can see in the above chart. We should remember that Nucor’s net debt rose slightly in the most recent quarter. The company generated negative free cash flows in the quarter due to working capital build up. You can read A Comparative Analysis of Steel Companies’ 2Q17 Earnings to analyze steel companies’ 2Q17 cash flows.
 
ArcelorMittal (MT) has a net debt-to-EBITDA multiple of 1.50x based on its TTM EBITDA. The company’s leverage ratios look comfortable based on the metric. The company’s financial leverage is the lowest since 2009. It’s looking for an “investment grade” credit rating, according to CEO Lakshmi Mittal.
 
U.S. Steel
U.S. Steel (X) has a net debt-to-EBITDA ratio of 1.53x, while AK Steel’s (AKS) net debt-to-EBITDA ratio is 2.62x based on its TTM financials. Notably, AK Steel has the highest financial leverage in our coverage of steel stocks based on most financial metrics.
Concurrent Events

Beijing Hiven Exhibition Co., Ltd.

haiwen2002@126.com

86-10-68659227 / 9226

legal informatics |Privacy data protection | ? 2017 Beijing Hiven Exhibition Co., Ltd京ICP备14033042号-8